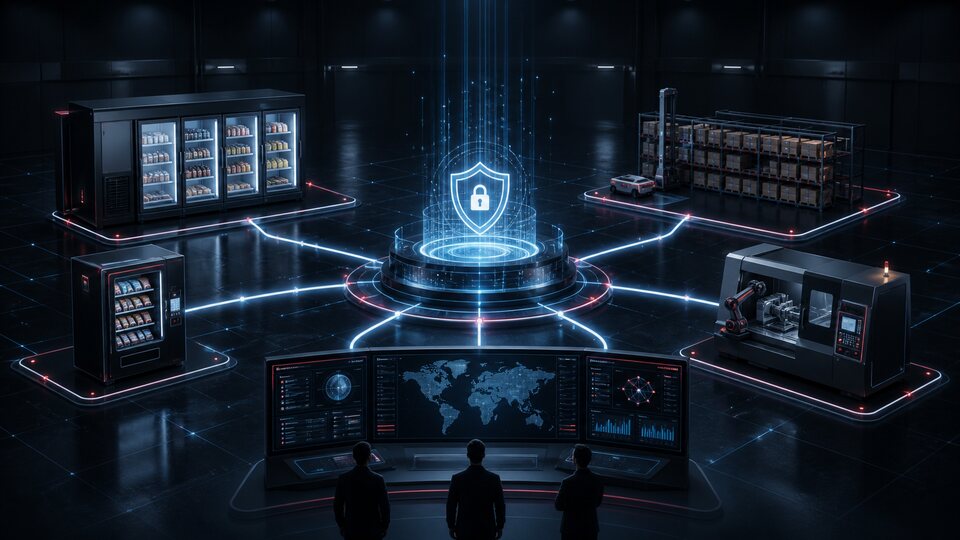
Refrigerators, warehouses, shops and production equipment under control from a browser
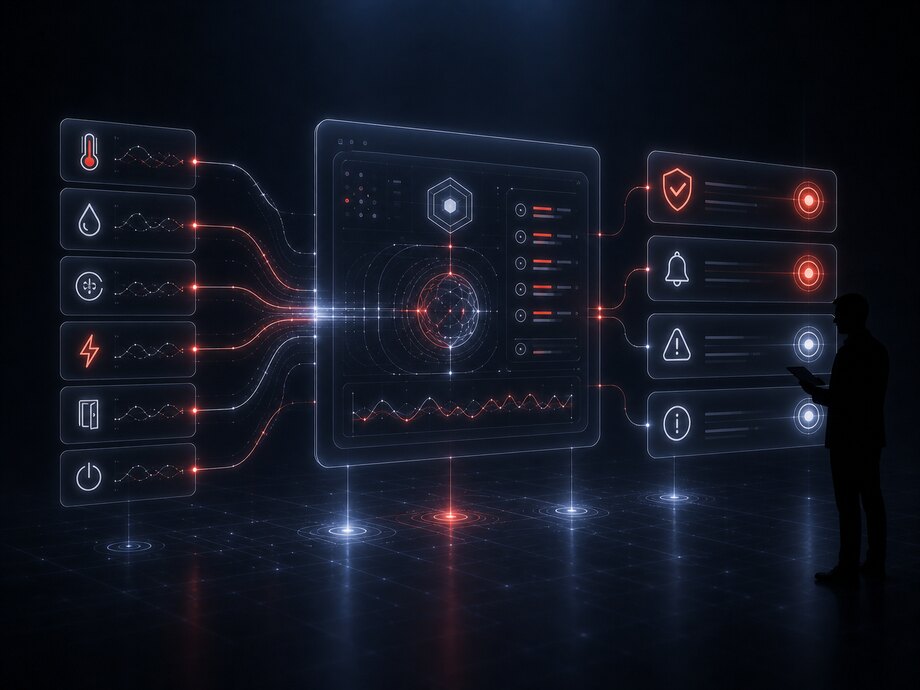
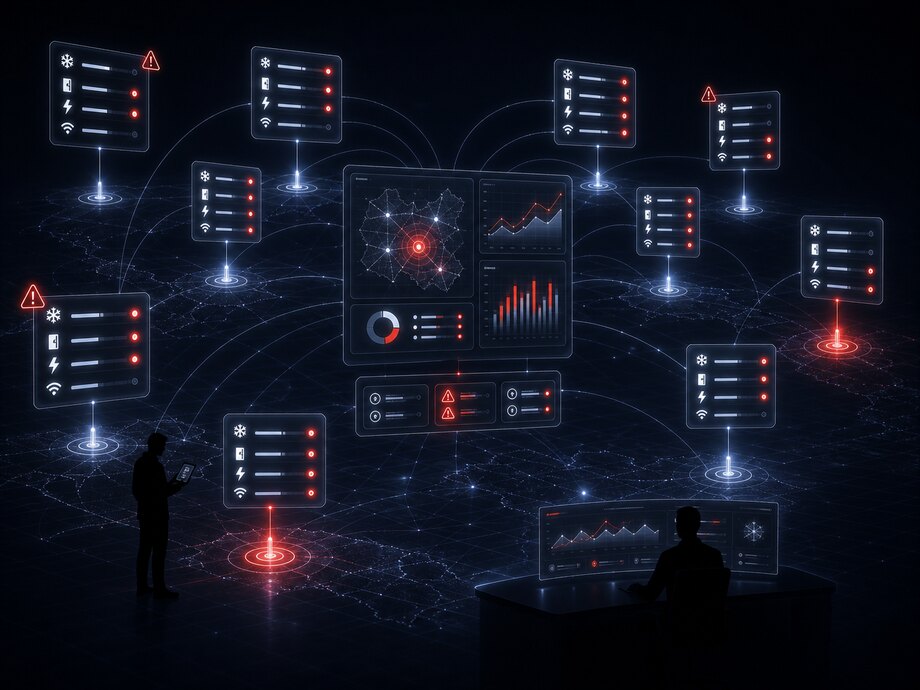
The equipment is out at the sites and you are in the office. We fit sensors to it, connect them to the internet and display the readings in one program that opens in a browser. If the temperature goes outside its limits, a door has been left open or the power has failed, the responsible employee gets a message immediately rather than finding out in the morning from the spoiled goods.
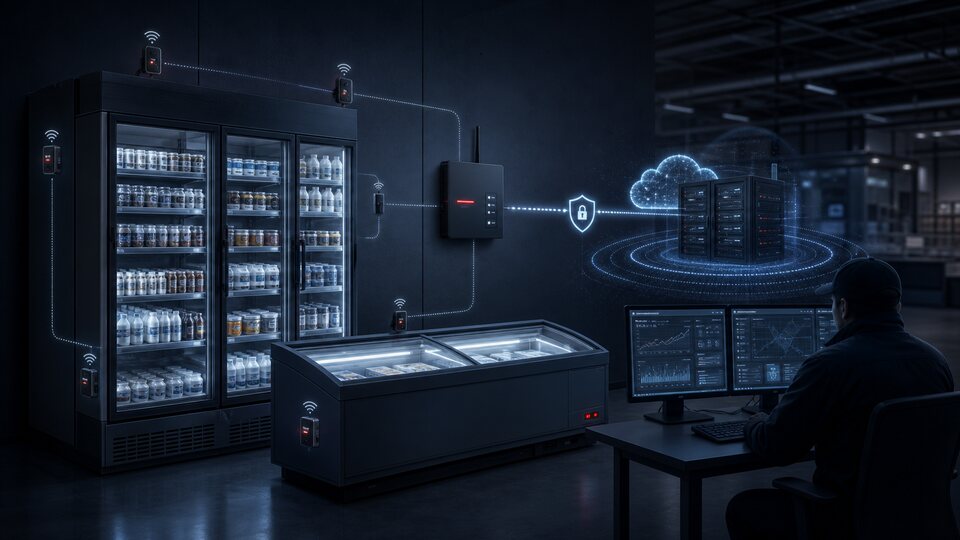
In plain terms: small devices are fitted to the equipment and continuously measure what matters — the temperature inside a cold room, whether a door is open, whether there is power, whether the compressor is running. Once a minute these measurements go over the internet to a server. You open a browser and see the state of every unit of equipment at every location.
IoT stands for the internet of things. The point is that instead of a person walking around with a notebook writing readings down, the equipment sends them to the software itself. Nothing has to be done for this: the data arrives on its own, around the clock, including nights and weekends.
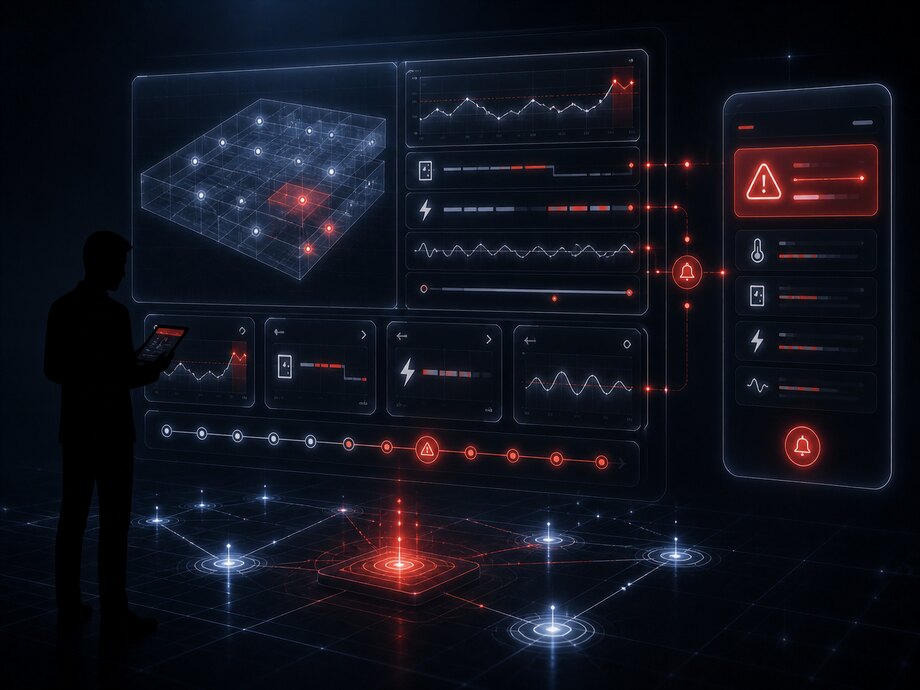
The main difference from a simple screen of figures is that the system does not wait for somebody to look at it. It compares every measurement against the norm you set for that equipment. If the norm is breached, it finds the employee responsible for that site in the directory and sends the message to them.
An example. In a freezer room at the warehouse −18 °C is the permitted level. At 21:04 the sensor reports −16.8 °C. Nobody is looking at the screen at that moment. Fifteen minutes later the temperature is still rising — the system creates an event, records the room number, the warehouse address, the time and the current value in it, and sends a message to the warehouse duty officer. At 21:33 they arrive and find the vestibule door not properly closed. The goods are intact.
None of the equipment has to be replaced. The refrigerator, vending machine, pump or air handling unit stays where it is — what is added is what it does not have: sensors, a communication device and software in which the whole fleet is visible as a single list.
Every project starts with three questions: what can physically be measured on this equipment; how the data will leave the site and reach the internet; who is responsible for a deviation and how many minutes they have to respond. Until the third question has an answer, what you get is a nice screen of figures rather than a system that prevents anything.
How monitoring differs from a chart on a screena look at one criterion at a time
What is implemented
What it amounts to
The reading is shown on screen in real time
observation
The reading is stored in a history with an exact time
a foundation
Going outside the norm is recorded as a separate event
a foundation
The event has a specific employee and a response deadline
monitoring
The employee's response is recorded and closes the event
monitoring
The line runs along two things: an event has a person and it has a deadline. A screen showing the current temperature saves nothing by itself — while nobody has been told to look into it, a deviation stays a line on a chart. That is why the norm, the responsible person, the response deadline and the closing mark are mandatory fields of the system rather than optional settings.
What this gives you in practice
All the equipment in one list — refrigerators, machines and units of different makes at different addresses on one screen, instead of in four manufacturers' programs
The employee goes where the problem is — instead of touring every location in turn, they get the address and the number of a specific unit of equipment
Investigation from records, not from memory — a month later you can see when the deviation started, how long it lasted and who responded to it
A response before the loss — a rising temperature is visible tens of minutes before the goods would have to be written off
Proof of storage conditions — a temperature chart for a month can be exported for any cold room and shown to an inspector or to a counterparty chain
Some actions straight from the browser — changing the setpoint temperature, for example, if the equipment's controller accepts such a command
The limits of what is possible are set by the equipment, not by the software: only what it measures or what a sensor can measure can be read, and only what its controller permits can be changed. What is available on your model is established from the manufacturer's documentation during discovery.
How it works: from the sensor to the message to an employee
The whole path a single measurement takes — from the device on the refrigerator to the message on a phone. Further down the page each of these six links is examined in more detail.
1. The equipment
What is being watched: a cold room, a display case, a freezer, a vending machine, a pump, an air handling unit, a production line. Every unit is registered in the system as a separate card — what it is, which site it stands at, what its datasheet says and when it was last serviced.
2. Sensors and controllers
The devices that measure. A sensor is a small device measuring one value: temperature, humidity, pressure, current, whether a door is open, whether there is voltage. A controller is the equipment's own brain: on some models it can report its readings and error codes to the outside, and then no extra sensors are needed. Where it cannot, we fit our own.
3. Data transmission
How the readings reach the internet. A small communication device is installed at the site: it collects the measurements from the sensors and sends them to the server over an internet cable, Wi-Fi or a SIM card. If the internet goes down, the measurements accumulate in its memory and go out when the connection returns. The device's own silence counts as an alarm too.
4. The cloud server
Where the data lives. A server is a computer in a secure data center running around the clock. Cloud means it does not stand in your office: there is nothing to buy, cool or service, and the software can be reached from anywhere. The server receives the measurements, stores them in the history, checks them against the norms and turns a deviation into an event.
5. The control panel
The program you see. It opens in a browser on a computer or a phone with a login and password — nothing to install. On one screen: sites, equipment, current readings and the list of open deviations. Equipment of different makes all looks the same.
6. Messages, reports, commands
The outcome of the whole chain: a message to a specific employee, charts and logs for investigation, monthly reports and — where the controller permits it — changing the equipment's settings straight from the panel.
The path of one measurementtemperature in a cold room
SensorOnce a minute it measures the temperature in the room and records the value together with the exact time
Communication deviceCollects the measurements and sends them over the internet; if there is no connection it holds them and sends them on later
Reception in the cloudThe server checks which device the data came from and in what units, and stores the record. Previous records are not erased
Comparison with the normThe value is checked against this room's permitted range and against the rate at which the temperature is changing
EventThe norm is breached — a record is created: what happened, on which equipment and at which site, when it started, what the current value is
MessageGoes to the employee responsible for that site. The event stays open until somebody responds and closes it
The measurement frequency and the permitted limits are set separately for every type of equipment rather than as one figure for the whole network. A freezer, a chilled display of ready meals and a warehouse cold room differ both in what temperature is normal and in how long it may be exceeded.
Refrigeration equipment
under continuous monitoring
Refrigeration is the area where monitoring pays for itself fastest, because a breach of the regime is invisible to the eye. Nobody notices a door left ajar overnight, and by morning the decision has already been made for you.
An example. On a Friday evening the compressor in a freezer room fails. Overnight the goods thaw, on Saturday they are partly refrozen, and on Monday the batch is written off. With monitoring, the message about the failure arrives at 21:00 on Friday, and the matter ends with a call to the service company.
The equipment varies, too. A freezer and a chilled display of ready meals share neither the permitted temperature, nor the speed at which it is breached, nor the cost of an error. That is why the norm is set for each unit rather than once for the network — taking into account what is stored inside it.
What can be read from a refrigeration unit:
Temperature — the current value at a set measurement frequency, at one or several points inside the volume
Rate of temperature change — not only how much now but how fast it is changing: a slow drift and a sharp jump mean different faults
Door opening — when it was opened, when it was closed and how long it stood open
Compressor operation — running or stopped, how often it starts and for how long
Power supply — whether there is voltage at the equipment and at what moment it was lost
Controller errors — fault codes the unit reports itself, where its controller can do that
Connectivity — whether the device checked in on time or has been silent longer than permitted
The set depends on the specific model. If the factory controller exposes values and error codes, the system reads them directly. If it does not, external sensors for temperature, door and power are fitted. What is available on your equipment is determined from its documentation during discovery rather than promised in advance.
Why one figure is not enough
Norm and time together — when goods are loaded the temperature rises for a few minutes, and that is normal; the same degrees forty minutes later are an emergency
Rate of change — a rise of one degree an hour and a jump within five minutes call for different responses
The link with the door — a temperature rise with the door open and with it closed are different problems and go to different people
The defrost cycle — during a normal defrost the temperature rises by itself; the system has to know this and not raise a false alarm every few hours
Power loss — what matters is not the fact itself but how long the room will hold and at what point the goods have to be moved out
That is why the norms are configured for the type of equipment and for the goods inside it. Without that, messages start arriving constantly, employees stop opening them — and the system runs for nothing.
Which refrigeration equipment can be connected
The devices used across these groups are roughly the same. The difference lies in the permitted regime, in the cost of an error and in who the message goes to. The structure is identical throughout: a unit of equipment, a site, readings, norms, events, a responsible person.
Micro market refrigerators
A location with no shop assistant: there is simply nobody to notice that a door did not close or a unit has stopped. The equipment stands in an office, a factory or a coworking space, and an employee comes by every few days. Temperature and door monitoring here is the only way to learn about a problem in time.
Freezers
Deep sub-zero temperatures and a large reserve of cold: a deviation develops slowly and is discovered through a whole batch being spoiled. What is monitored is the temperature, how long it stays outside the norm, compressor operation and defrosting.
Refrigerated display cases
On the sales floor the door is opened dozens of times a shift, so the regime is breached constantly. What matters is therefore not the excursion itself but how long it lasts and how often it repeats during the day.
Cold rooms
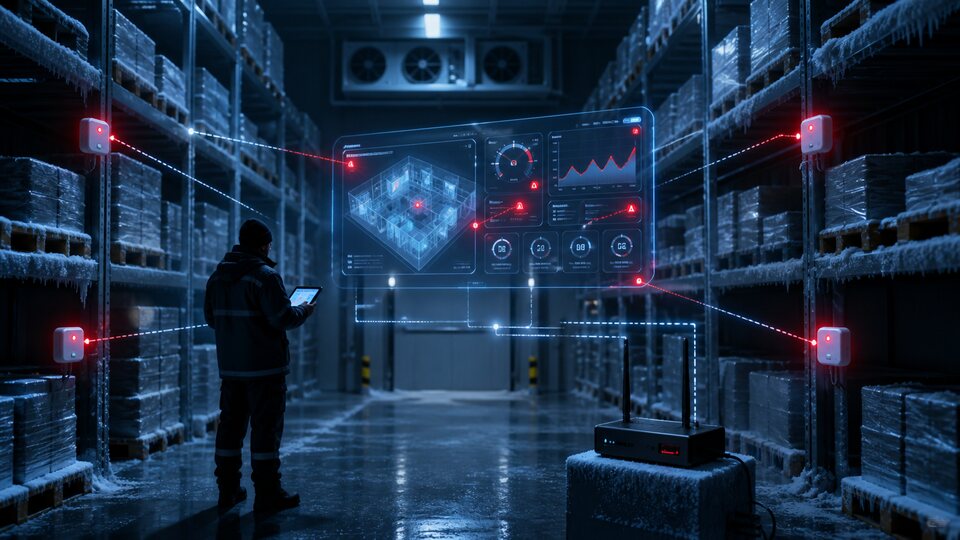
A large volume with several zones at different temperatures: one measurement point does not describe the room. Several sensors are fitted, and the door and the power are monitored separately — a cold room stopping means losing the entire contents, not one shelf.
Warehouse refrigeration systems
Several rooms and units at one site, working in shifts and around the clock. What is needed is a split of responsibility by zone, a long history and a report on compliance with the regime for a month or a quarter.
Shop equipment
A chain of locations with identical equipment: dozens of display cases and chest freezers at different addresses. The value here is in comparison — where deviations repeat, which location systematically falls outside the regime, which unit is due for repair.
Restaurants and food production
Storage of raw materials and finished products, where the regime is a requirement rather than a convenience. Besides the messages, provability is needed: a chart for every room over a period and records of who responded to deviations and how.
Equipment that reports nothing
A separate group is made up of units whose controller was never designed to communicate outwards at all. They are connected with external sensors: temperature, door, power, current draw. There is less data than from a smart unit, but the essentials — the regime, the door, the power and the compressor — are visible, and such a unit sits in the common list alongside the rest.
What is monitored
and when it becomes an alarm
Every reading lives in the system in two forms. The first is the value itself, which is simply stored in the history. The second is a rule: at what value and after how many minutes this becomes a deviation somebody has to be told about.
An example. A temperature of −16 °C in a freezer room is always stored, every minute. But a message goes out only if it stays above −18 °C for more than fifteen minutes in a row.
The full list of what is read and monitored:
Temperature — the current value at each measurement point, at the frequency set for that type of equipment
Temperature change — which way it is going and how fast: rising, falling or fluctuating within the norm
Going outside the permitted values — it has become warmer or colder than allowed for this unit
Equipment status — running, idle, in service, in alarm, offline
Compressor operation — running or stopped, how long it runs and how long it rests
Door openings — the fact of the opening, the time it was opened and the time it was closed
A door open too long — a single opening lasts longer than permitted
Power supply — whether there is voltage at the equipment
Power loss — when it was lost, how long it was absent, when it came back
Controller errors — the codes the equipment reports itself, decoded from the documentation for its model
Alarm states — a separate category with the highest priority and its own notification rule
The need for defrosting — from whatever signs are available on this equipment: a controller signal, running hours, the shape of the temperature cycle
Duty cycles — how many times and for how long the unit started during a period, and how many hours it has run in total
Loss of connection — the device has not checked in for longer than the permitted interval
Loss of connection is not a trifle but a full-blown alarm. A silent device does not mean no data but we know nothing about this site. The temperature there may be within the norm, or it may have been rising for an hour. That is why a loss of connection creates the same kind of event as a temperature alarm instead of leaving a gap in the chart.
Not every deviation is an emergency
There are four levels, and the level determines who the system disturbs and how:
Note — written to the history, disturbs nobody: a brief door opening, a normal defrost, a spike while goods are loaded
Warning — there is a deviation, but there is also time to respond: the message goes to the person responsible for the site
Emergency — the regime is breached or the equipment is unreachable: the message goes to several employees at once and does not clear itself until the event is closed
For servicing — the equipment is running, but the readings point to wear: the task goes not to the duty officer but into the maintenance plan
Who receives the message
Every site in the system has a responsible employee, and every event type has its own delivery rule. The system does not send everything to everyone: it looks at which site the deviation is at, what type it is and what time it is, and picks the addressee by that rule.
The site duty officer — ordinary deviations during their shift
The department head — alarms and events nobody picked up in time
The service team — maintenance tasks and controller error codes
If an employee has not accepted an event within the allotted time, it automatically goes to the next person in the chain. At night, at weekends and on public holidays the addressee may be different — that too is configured in advance.
What is recorded for every event
The type, the equipment and the site, the start and end times, the readings at the moment it arose, who the message went to and when, who accepted it, what they did and how it ended. That is enough to investigate a case from records a month later rather than from what the shift remembers.
Rules for a single cold rooma screen from the system
Condition
Hold time
Event
Temperature above the upper limit of the regime
15 min
warning
Temperature above the limit
45 min
alarm
Door open continuously
5 min
warning
Temperature rising with the door closed
10 min
alarm
No voltage at the equipment
1 min
alarm
The controller returned an error code
immediately
alarm
The device is not checking in
20 min
alarm
The compressor ran longer than usual over 24 hours
24 hours
for servicing
A screen from the system; the values are illustrative. The hold time column is how long the system waits before raising an alarm. Without it, loading goods, a normal defrost and cleaning the sales floor would produce a stream of false alarms, after which the messages stop being read.
Six cases: what this looks like in practice
Every case follows the same path: something changed on the equipment → the system recorded it as an event → a specific employee received a message. The only differences are the cause and who it is addressed to.
A door left open
What happens: the sensor reported that the door was opened and, for longer than permitted, has not reported it being closed. What the system does: creates a door open longer than the norm event with the equipment number, the site address and the start time. Who finds out: the employee at the location — the message shows how long the door has already been open. The event will not close until the door is closed.
The temperature is rising
What happens: the measurements show a steady rise while the door is closed. What the system does: records the deviation with the current value and the rate of rise. Who finds out: the person responsible for the site receives a warning — the goods are still fine and there is time to respond. If the rise continues, the warning becomes an alarm and goes to several employees.
The equipment has gone offline
What happens: the device has been silent for longer than the permitted interval. What the system does: creates an alarm — not no data but an alarm: what is happening at the site is unknown. Who finds out: the same employees as for a temperature alarm, because the consequences can be the same.
The controller reported an error
What happens: the equipment returns a fault code itself. What the system does: records the code as it is and decodes it from the documentation for that model. Who finds out: the error appears on the equipment card together with the history — how many times the same code has already come from this unit.
Defrosting is required
What happens: the signs that defrosting is needed — a controller signal, running hours or the shape of the temperature cycle — go outside the norm. What the system does: creates a task rather than an alarm. Who finds out: the responsible employee — the task states what equipment it is, at which site and by when.
The power has failed
What happens: there is no voltage at the equipment. What the system does: creates an alarm with the exact time of the failure; the temperature keeps being recorded while the communication device runs on its own battery. Who finds out: the message goes out immediately — it is what the decision to move the goods out is based on, rather than when to call for a repair.
One deviation end to endan event log, a screen from the system
21:04 — changeCold room no. 2, Vostochny warehouse: temperature −16.8 °C against an upper limit of −18.0 °C, door closed
21:04 — recordThe deviation is written to the history. The rule waits 15 minutes, so no message goes out yet
21:19 — eventTemperature −15.9 °C, still rising. A warning is created: the limit has been exceeded for longer than the hold time
21:19 — messageSent to the warehouse duty officer and the shift supervisor; the card shows the value, the rate of rise and the start time
21:33 — responseThe duty officer marked that they were on the way; the system recorded who accepted the event and at what time
22:10 — closureThe temperature returned to normal. The event was closed with the reason vestibule door not properly closed; the deviation lasted 66 minutes
A screen from the system; the figures are illustrative. What matters here is not the message but the last line: the reason and the duration go into this room's history. If vestibule door not properly closed happens three more times in a month, it will show up in a report rather than being forgotten along with the shift.
We will look at your equipment and tell you what can actually be read from it
From the controllers' documentation and from the make-up of your fleet: which readings are available straight away, where sensors will have to be fitted and which settings can be controlled remotely.
The system is needed wherever equipment runs without constant supervision and a failure is noticed through its consequences. The set of readings and the cost of an error change — the structure of the system stays the same.
Vending — machines at remote locations: the state of the mechanism, temperature, the payment module, connectivity
Micro markets — display cases and refrigerators in offices and at enterprises where there is no shop assistant
Cold storage warehouses — cold rooms and units running around the clock where storage conditions have to be proved
Ordinary warehouses — temperature and humidity in the premises, power, access to zones, the state of the building systems
Retail equipment — display cases, chest freezers and cabinets on the sales floors of a chain of shops
Climate systems — whether the set temperature in the premises is being held and by how much it deviates
Ventilation — whether the units are running, how clogged the filters are, how many hours have been logged
Air conditioning — the mode, how often it starts, the gap between the actual and the set temperature
Heating — flow and return temperatures, circuit operation, alarm states
Pumps — running or idle, how much power is drawn, how often it starts, how many hours it has run
Electric motors — current draw, running time, atypical operating modes
Production equipment — state, downtime, controller errors, hours run between services
Industrial equipment — a fleet from different manufacturers at one site or several
Power equipment — whether there is power, what its parameters are, whether the backup sources came on
Electronic locks — opening, closing, access attempts, the state of the lock
Sensors — temperature, humidity, pressure, current and other values that can be measured at the site
What all these cases have in common
Unattended equipment — days pass between an employee's visits, while a fault develops in hours
The fault is seen through its consequence — through spoiled goods, a stopped line or a flooded room, rather than through the fault itself
A mixed fleet — units of different makes and different years stand at the same site
There are many sites — touring the whole fleet by hand becomes impossible sooner than you would think
History is needed — to investigate a case, plan maintenance and prove storage conditions
If at least three of the five points match your situation, the payback can be calculated from the specific losses you have already had in past periods — written-off goods, downtime, wasted call-outs.
Which of these we have already done
Vending and micro markets: the telemetry module, the software on the device and the collection of events — sales, mechanism errors, temperature, door openings, the state of the payment modules and of the connection — were built by us and are described in the section on self-service systems page. The other areas in the list are the same scheme applied to a different type of equipment.
Equipment of different makes
in one program
A real fleet is almost never uniform. At one site there are units of different years and different manufacturers: some have a controller that can pass data outwards; others have a controller that cannot talk; and others have nothing beyond the power section.
Hence the usual picture: four programs for four types of equipment, each with its own login, its own state labels and its own notifications. None of them gives an overall picture of the site, and comparing two units of different makes with each other is impossible altogether.
What we do in such a situation:
A fleet inventory — for each unit: model, year, controller, what it can expose and by what means, whether the manufacturer's documentation exists
A list of what is available — we record which readings can be taken directly, which commands are accepted and what will have to be covered by external sensors
A translator program for each type — a separate exchange module is written for every kind of controller: it knows how to take data from that one specifically and passes it on in one common format. Such a module is called an adapter
One vocabulary of states — instead of different labels from every manufacturer there is one common set: running, idle, warning, alarm, offline, in service
Verification on live equipment — the module is verified on site rather than from a description: a mismatch between the documentation and the controller's actual behavior is a routine occurrence
What we do not state in advance. We do not claim support for specific equipment brands and industrial protocols before discovery. The list of what can be read and what can be controlled is the result of working with your fleet's documentation and verifying it on site, not a line in a presentation. The one thing backed by finished development is the vending layer: our own telemetry module with MDB and EVA-DTS drivers, described in the section on self-service systems page.
What remote diagnostics gives you
A call-out with a purpose — the engineer knows what happened before setting out and takes the right part with them
Investigation from records — what was happening before the breakdown is visible in the history rather than reconstructed from what the operator says
Comparing identical units — if one unit out of five is not behaving like the rest, it shows in the summary rather than a year later on a repair bill
Servicing by actual use — by hours run and number of starts rather than by a date on a schedule
A check after a repair — whether the readings have returned to normal is visible from the panel, without a second call-out
When remote control is possible
Changing equipment settings from a browser is not always possible. That is a property of the equipment rather than of the software, and there are three cases:
The controller accepts commands from outside — the setpoint temperature and the operating modes can be changed from the panel, and the unit can be switched on and off
The controller only outputs — the system shows the state but changes nothing
There is no controller, only external sensors — there is no control at all: a sensor can only measure
This cannot be worked around in software. That is why we name the list of available commands after discovery, not before it.
One program instead of four
The mix of makes is resolved not on site but inside the software: a translator is written for every type of equipment, and from there everything is identical. That is why a new type is connected by writing one module rather than by rebuilding the panel, the rules and the reports.
1. Different data sources
Controllers able to pass data outwards; controllers without that ability; external sensors; communication devices. Each has its own format, its own units of measure, its own state labels and its own reporting frequency.
2. The translator program
A separate module is written for every type of source: it knows how to take data from that one specifically and converts it into a single internal format. The equipment is not changed — the software adapts. Such a module is called an adapter.
3. Bringing it to a single form
Identical units of measure, one list of states, an identical description of an event. After that a cold room and a pump are described in the same language, and the norm rules are written once for everything rather than separately for every make.
4. A single panel
One screen for the whole fleet: sites, equipment, readings, open deviations, history, reports and available commands. An employee works in one program instead of switching between four.
One fleet, four sourcesa screen from the system
Data source
What can be read
Control
State
A controller able to pass data outwards
values, modes, error codes
partly, per the documentation
online
A controller that exposes nothing
through external sensors
no
online
External sensors on a communication device
temperature, door, power, current
no
warning
A vending telemetry module
sales, mechanism errors, temperature, door
yes
offline
A screen from the system; the make-up is illustrative. In the panel all four rows look the same — the only difference remains in the what can be read and control columns, that is, in what the source physically allows. Whether control exists is decided by the equipment's controller, not by the software.
What you see
in the control panel
The panel opens in a browser with a login and password — like an ordinary website. There is nothing to install, and it works from a phone as well.
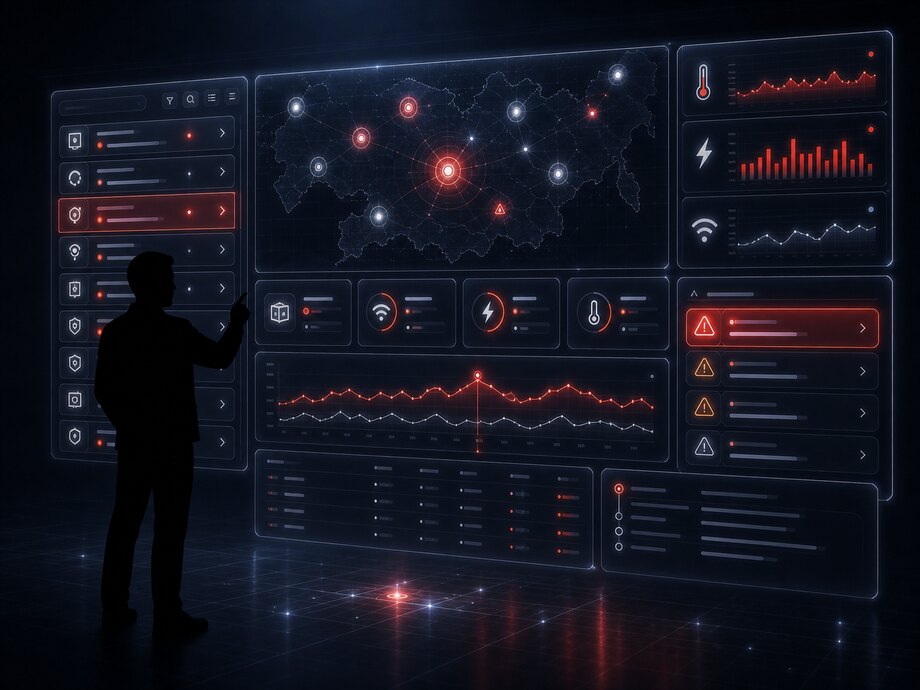
The first screen. Counters at the top: how many devices are online right now, how many are silent, how many deviations are open at this moment. Below is the list of sites, with their equipment under each one; every unit has a color-coded state (normal, warning, alarm, offline) and its current value.
The equipment card opens on a click on any unit. It brings together everything known about that refrigerator or unit:
Current readings — temperature, door, power, compressor operation at this moment
A chart for a period — how the reading changed over a day, a week or a month; door openings, compressor starts and power failures are marked on the line
Event log — every deviation for this unit: when it arose, who it went to, who accepted it, how it was closed
Error log — the codes the controller reported, with decoding and a history of repeats
Measurement history — every reading for the retention period, without thinning, with export to a file
Datasheet and servicing — the model, the installation date, what was done to this unit and when
Control — the setpoint temperature and modes, if the equipment's controller accepts commands; every change is written to the log with its author and result
The settings are made once and work by themselves from then on: norms and hold times by type of equipment; responsible people and message delivery rules by site, event type and time of day; employee roles — who sees what and who can do what; groups and filters by site, region and equipment type.
Why the history is kept. It is every measurement and every event, stored with an exact time and available at any moment. It is needed for five things:
Investigating a case after the fact — what happened to the cold room on Friday night is visible minute by minute rather than from what the shift remembers
Proving storage conditions — a chart for a period is exported to a file and shown to an inspector or to a counterparty chain
Arguing with the service company from facts — how many times the unit went into alarm after a repair is visible in the log
Planning maintenance — by actual hours run and number of starts rather than by a date on a schedule
Noticing wear — comparing how the same unit was running six months ago and how it runs now
A separate word about charts: they are there for investigation, not for reporting. When door openings, compressor starts and power failures are marked on the temperature line, the cause of a deviation reads immediately — there is no need to line up four different screens.
How remote commands work
Only what the controller accepts — the list of available commands is determined by the equipment model and fixed at connection time
A right that comes with the role — the whole shift can view the state, while only a limited group of employees can change settings
Confirmation of the result — a command counts as executed not when it was sent but when the equipment has answered
An entry in the log — who changed what and when, what the value was beforehand and what the equipment returned
A bounded range — the setpoint temperature cannot be taken outside the limits set for that type of equipment, even if the controller would accept such a command
If the controller does not accept commands, the control section simply does not appear on the card. There is no dead button there — so that the shift never gets the impression that the equipment can be controlled from here.
When there are dozens of sites
or hundreds
At a single site with five refrigerators any approach will do, even a notebook. The difference starts at fifty units and at five hundred: the list stops fitting on a screen, the messages merge into a stream, and the employee responsible for everything stops being responsible for anything specific.
An example. At night the power is cut at one of the locations. Without configuration the system would send thirty separate alarms — one per unit of equipment — and everything else would be lost in that stream. With configuration, one message arrives: this site, power lost, 30 units affected.
What changes as the fleet grows:
The first screen shows problems, not everything — devices with an open deviation, sorted by urgency, rather than the whole list one after another
Grouping — by site, region, equipment type and responsible person, with its own state summary for each group
Its own addressee for every group — the delivery rule is tied to the site and the event type rather than to one shared list of recipients
Merging identical events — one cause does not turn into thirty separate messages
Escalation — an event nobody accepted within the allotted time automatically goes to the next person in the chain
Comparing units of the same type — which deviates most often, which spends the longest in deviation, which has the most running hours
Chain summarya screen from the system
214devices online
6offline
11open deviations
3alarms need a response
Refrigeration equipment128
Vending machines54
Climate and ventilation27
Pumps and compressors11
A screen from the system; the figures are illustrative. The order of the numbers is not accidental: what comes first is not the size of the fleet but how many sites are currently unobserved. Six silent devices are six locations about which nothing is known.
Reports for a period
Compliance with the regime — how long each unit spent within the norm and outside it, broken down by day
Deviations by cause — door, power, unit failure, loss of connection: where the same thing keeps repeating
Response speed — how long it took from an event arising to it being accepted and to it being closed, by site and by employee
Equipment running hours — hours run and number of starts over the period, the basis for planned maintenance
Availability — what share of the time the device was online; if it is low, every other figure loses its meaning
Reports export to a file and can be built automatically on a schedule — on the first of every month, for example. For the refrigeration layer such a report doubles as proof of storage conditions for the period.
Who sees what
Rights are granted along the same structure: a location employee sees only their own equipment, a department head sees every site of their type, a dispatcher sees the summary across the whole network. Viewing, accepting an event and remote control are separated rather than granted as one bundle.
Sensors and controllers
Transmission to the cloud
A single panel
Messages and reports
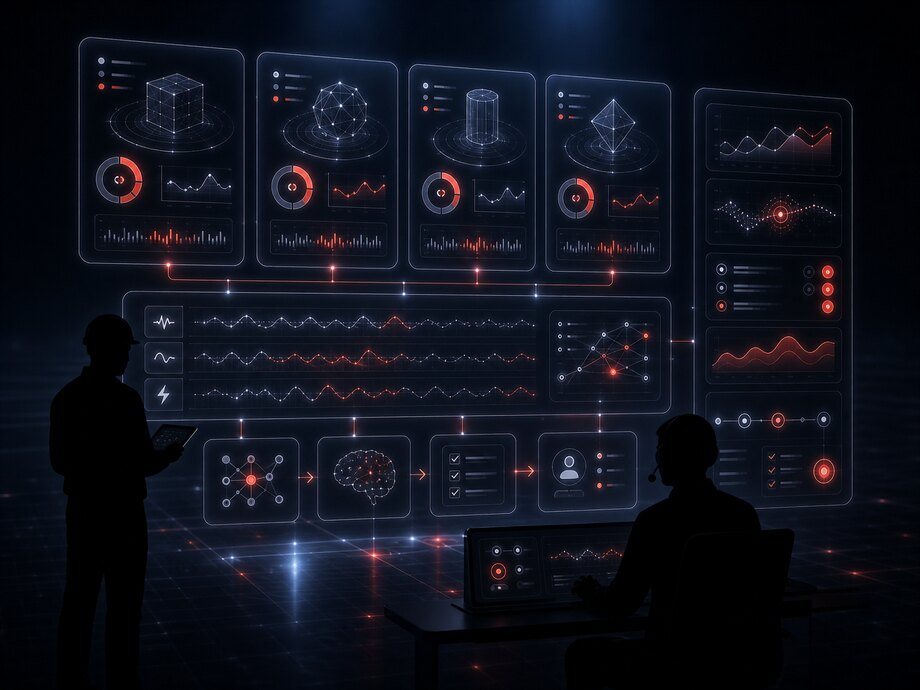
AI as an additional layer
once enough data has accumulated
The system's core work is built on simple rules: this value for longer than this many minutes = this message to this person. That is enough to cover emergencies, and it is where every adoption starts.
Once months of history have accumulated, data analysis can be added on top of it. It looks not for a limit being breached but for a change in the habitual behavior of a specific unit of equipment.
An example. A compressor usually reaches its operating mode in eight minutes. For the past three weeks it has needed twelve. No limit has been breached and no message would have been sent under the rules — but the unit is clearly heading for a failure, and it is better serviced before it stops on a weekend.
Accumulated history — readings and events for every unit over a long period, including records of repairs and replacements
Analysis — how a reading normally behaves, how running hours grow, how units of the same type differ from one another
Finding departures from the habitual — cycles have got longer, it takes longer to reach operating mode, current draw is atypical
Possible failure prediction — with an accumulated failure history, the probability of a failure can be estimated in advance and a repair planned before a stoppage
We state the boundary plainly. Failure prediction is something that becomes possible on accumulated data rather than a feature that works from day one. It needs a history not only of readings but of the failures themselves: without real cases there is nothing to train a model on. That is why in a project it is a separate stage after data collection has run for a period, rather than an item in the first release.
A related area is adopting artificial intelligence in business processes, where the same approach is applied to data from orders, enquiries and documents.
What analysis notices before the rules do
Wear before a breakdown — the compressor runs longer week by week while not a single limit is breached
A problem with a specific site — one cold room out of five regularly takes longer than the rest to reach its mode after the door is opened
An incorrectly set norm — a rule that fires every day at the same site is more likely misconfigured than reporting an emergency
Seasonality — the summer rise in load is separated from equipment wear, so a repair is not scheduled for nothing
None of this replaces the alarm rules: rules react within minutes, analysis works on a horizon of weeks. Both layers are needed, and they are adopted in exactly that order.
Implementation sequence
The stages come in exactly this order. Skipping discovery is the most common reason a system ends up built around equipment that does not expose the data it needs.
1. Discovery
A fleet inventory: models, controllers, documentation, what can physically be read from each unit, whether the sites have internet. The output is a list of what is available straight away and what will have to be covered by external sensors.
2. A pilot at one site
One site and a few units of equipment: installation, verification of the exchange on a live controller, tuning of the norms and hold times against how the equipment actually behaves rather than against the documentation.
3. Rules and responsible people
Who is responsible for which sites, which events go to whom, what counts as an alarm and what is merely a note. Escalation and the merging of identical events are configured here as well; otherwise the stream of messages will devalue the system within a month.
4. Rollout across the network
The remaining sites follow the proven pattern, and new equipment types come as separate exchange modules. From there the history accumulates, and period reports and data analysis appear.
Let us start with a fleet inventory — and no promises before it
What can be read from your controllers, what will be covered by external sensors and what can be controlled remotely will become clear from the documentation and from verification on site.
Tell us what equipment is installed at your sites, how much of it there is and which problems you currently learn about only through their consequences. We will tell you what can actually be read from it, where external sensors will be needed and where it makes sense to start the pilot.